
Your daily Excel reports come alive.
Rankings, dashboards and AI analysis.
- 1Upload your Excel report
- 2Pick what to rank
- 3Share and ask
Upload your Excel report
The same file you already get every day. No reformatting, no setup.
Pick what to rank
Sales, labor %, tickets, discounts — or your own calculated columns.
Share and ask
Everyone sees the same live board, and you can ask questions in plain English.
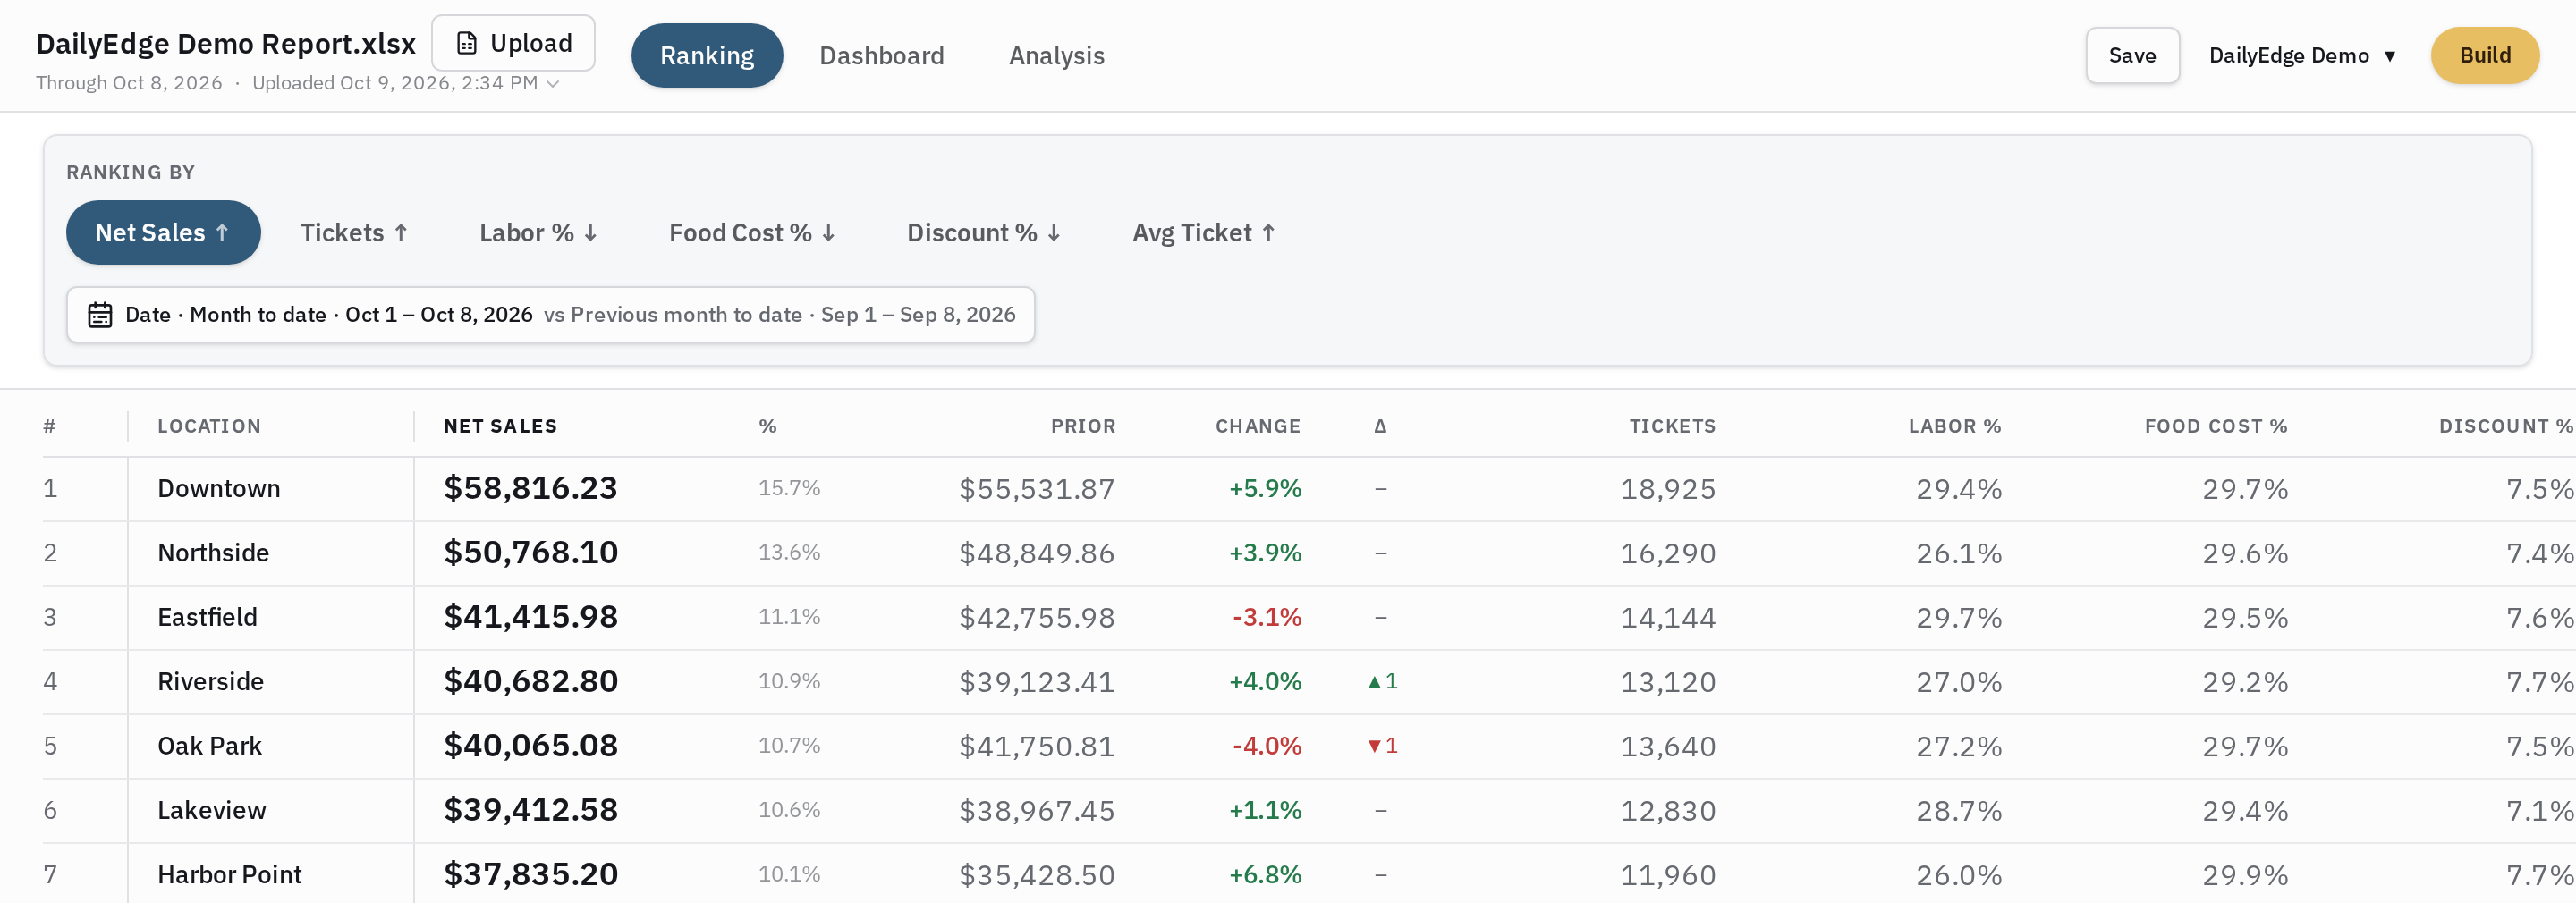
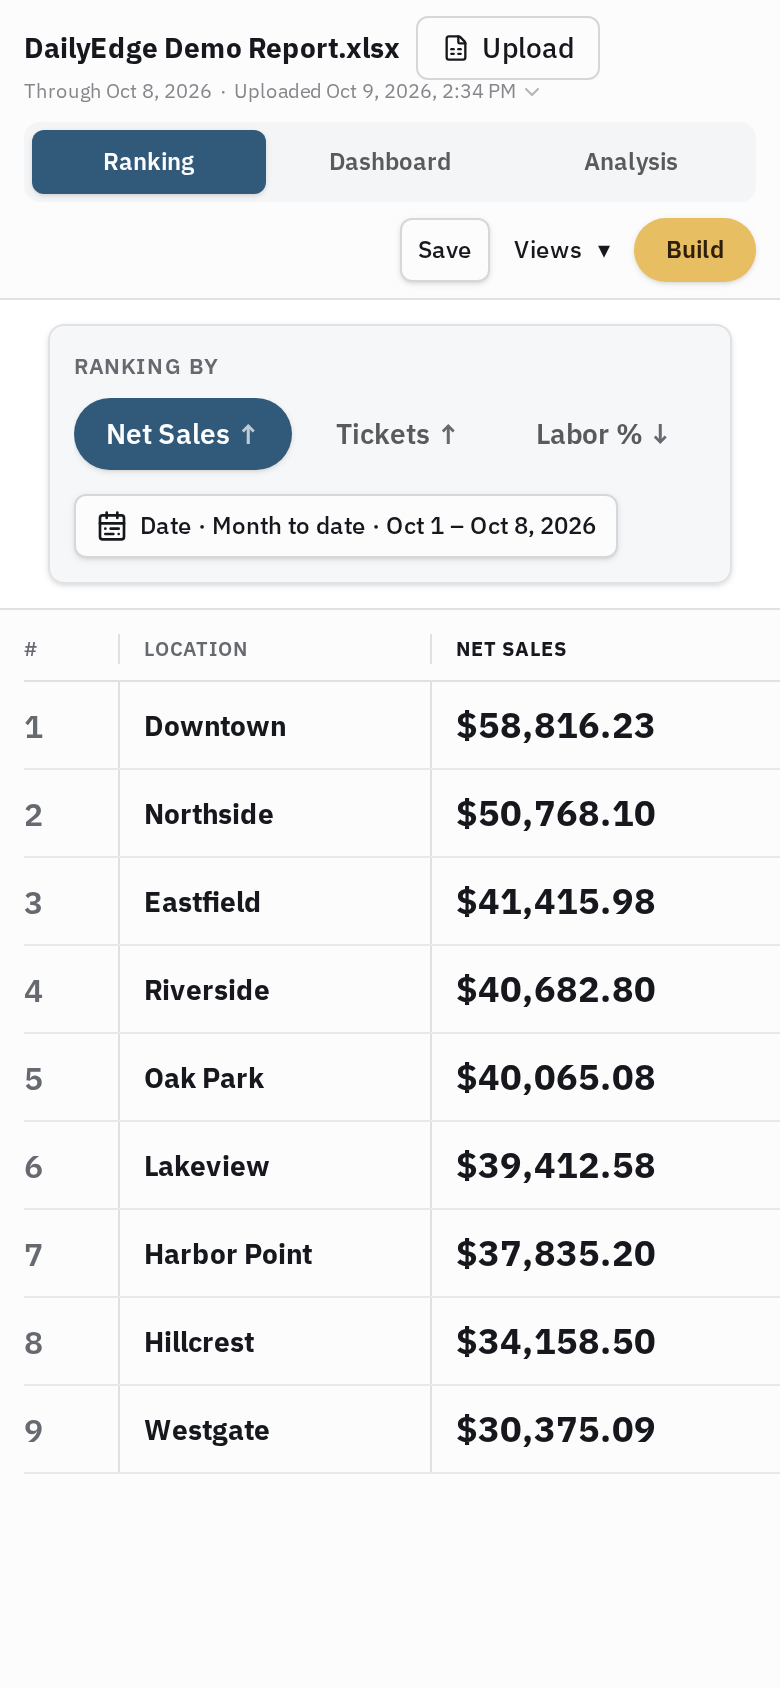
Rank every location, every day
One glance tells you who's winning and who needs attention. Compare any period to the previous one and see rank movement, prior values and percent change right on the board.
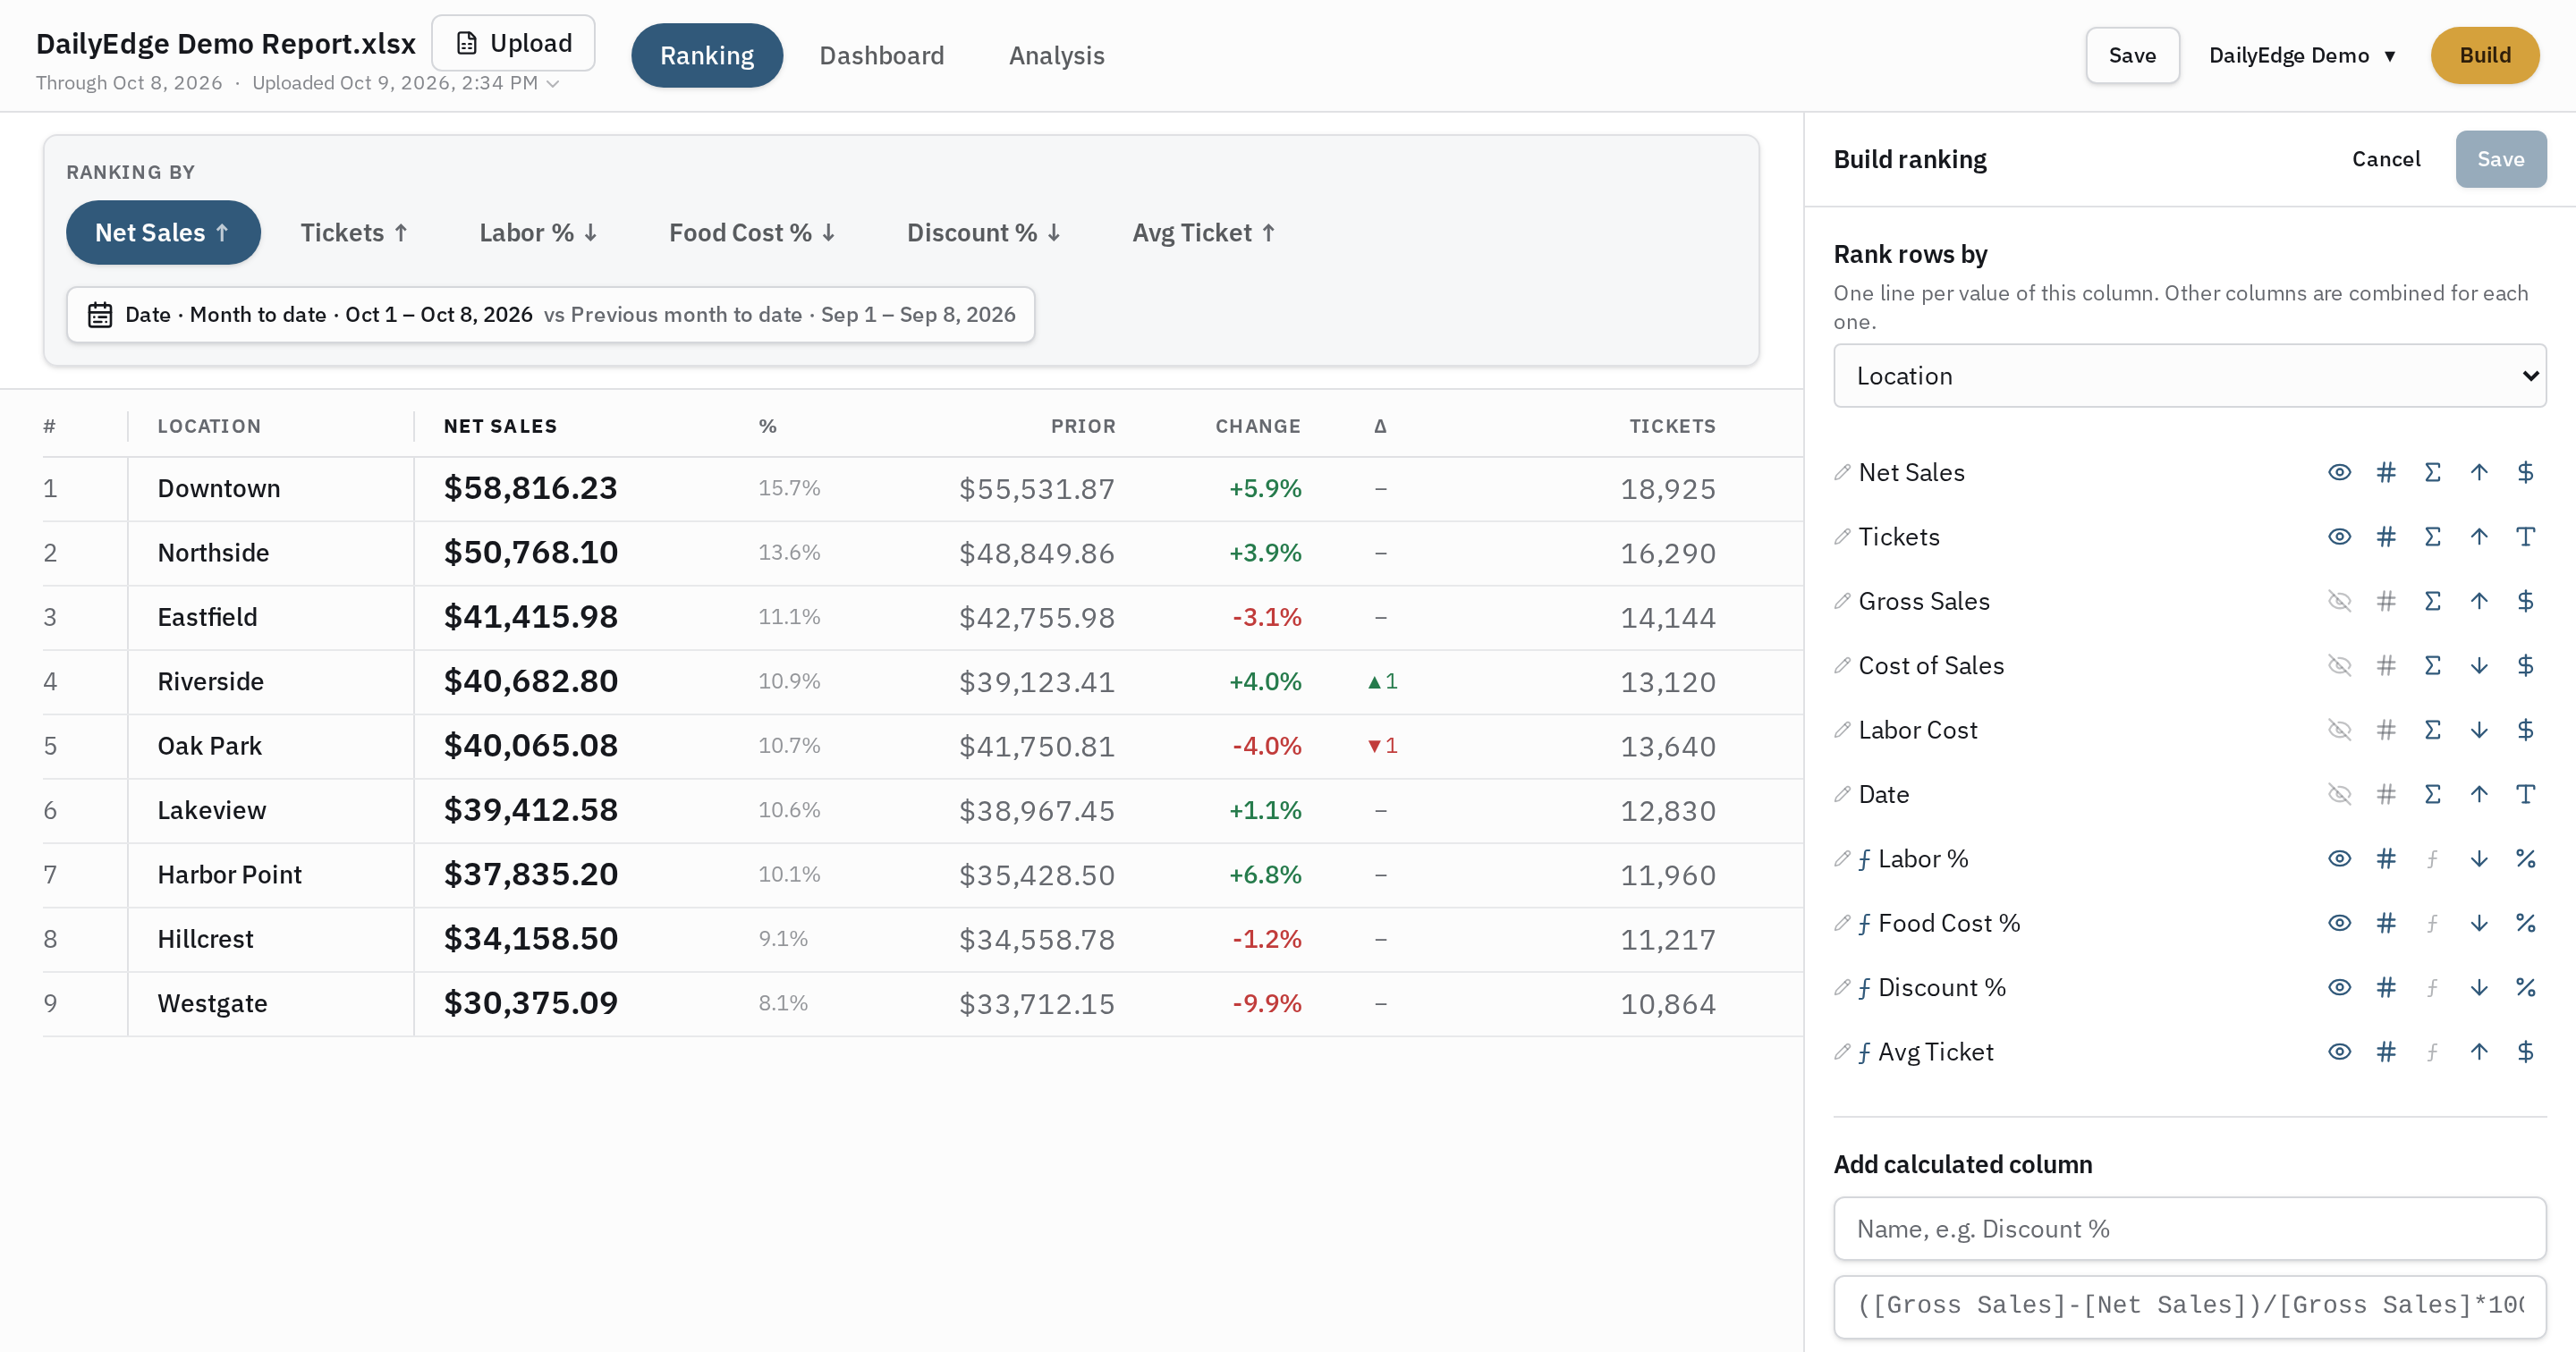
Your metrics, your way
Build calculated columns from the numbers already in your report — discount percentage, sales per ticket, cash-down rate — and rank on them like any built-in column.
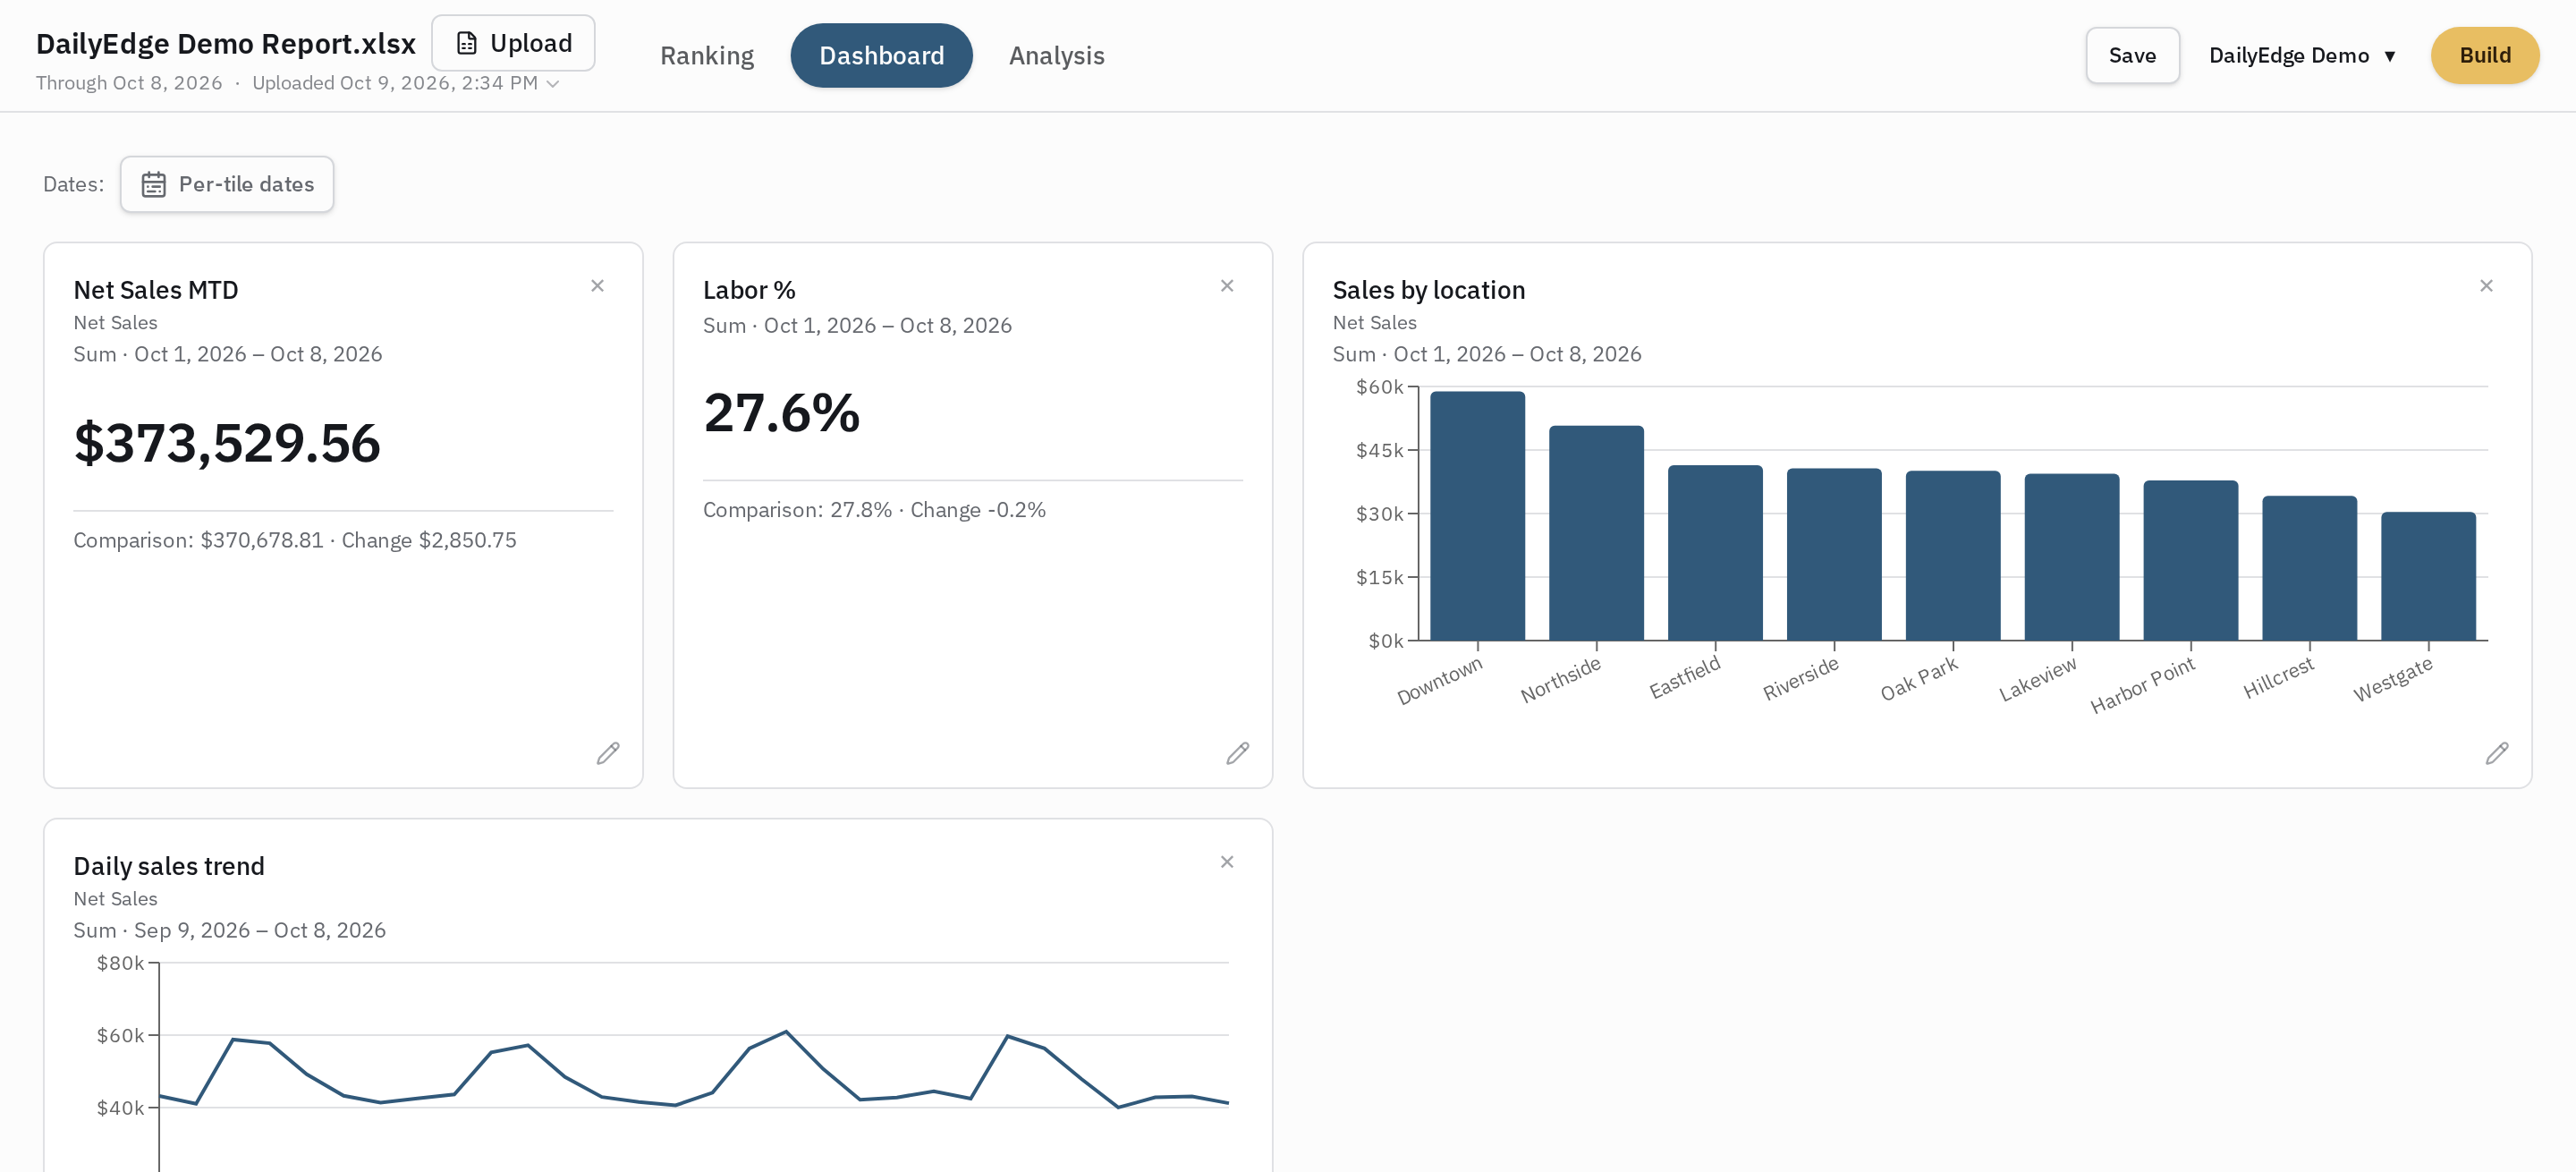
Dashboards that track the trend
Pin the numbers that matter as tiles: totals, averages, bars and trends over any date range, each with its own comparison period.
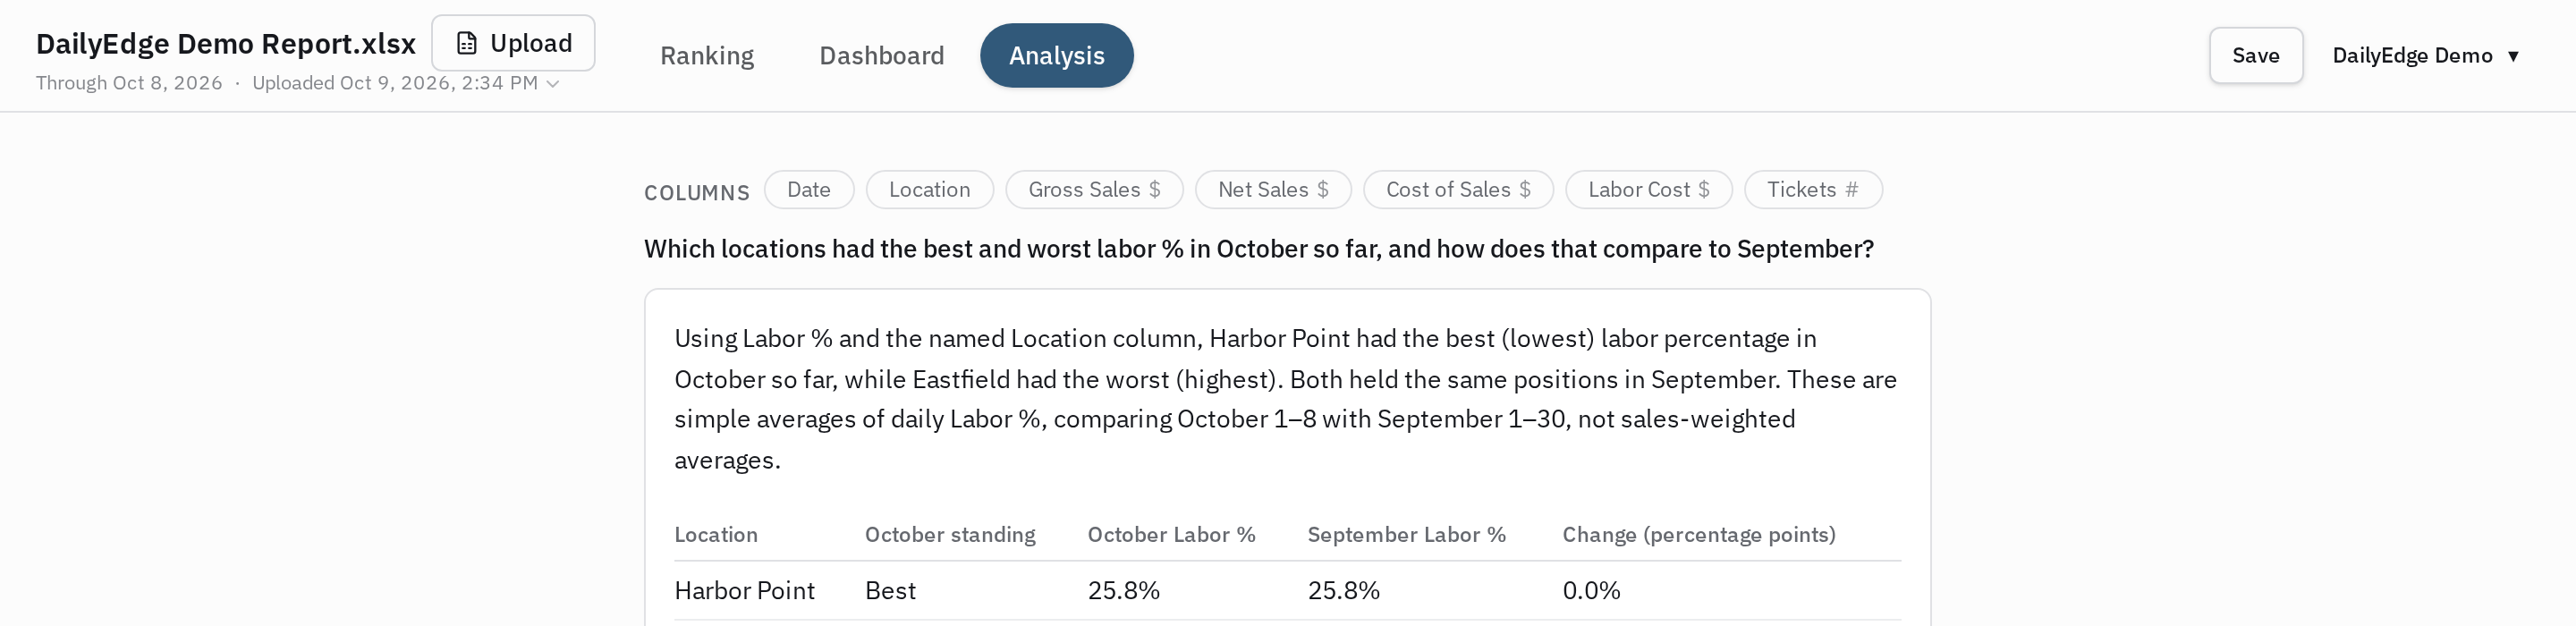
Ask in plain English
"Which location had the best labor percentage last week?" Just ask. DailyEdge reads your actual report data and answers with the numbers to back it up.
Check it from anywhere
The ranking fits in your pocket. Rank and location names stay pinned while you scroll the numbers — built for the parking-lot check before you walk in.
Built for any multi-location business
If your day starts with a spreadsheet of numbers per location, DailyEdge fits.
Request a demo
Tell us where to reach you and we'll set up a walkthrough with your own report.